A data center is a building whose product is computation and whose largest cost is electricity. That makes measurement unusually valuable. When a facility draws many megawatts around the clock, a one percent improvement in efficiency is worth real money, and a cooling problem caught an hour sooner can prevent an outage that costs far more. As Illinois's data center footprint expands, demand for connected energy monitoring is growing with it, and this has become a distinct opportunity within Energy & Sustainability. It follows from our earlier coverage of Illinois's data center construction boom, which focused on the build. This piece focuses on operations.
Chicago's data center market grew by more than 268 megawatts year over year through the end of 2025, with vacancy falling to 2.4 percent and rental rates up about 11 percent, according to CBRE. In some regions, data centers are the largest single source of utility load growth, and Illinois's new CRGA law was written partly in response to that surge. Utilities, regulators, and customers are all asking the same question: how much power is this facility using, when, and how efficiently? Answering it requires instrumentation at every level, from the utility meter down to the rack.
The industry's standard efficiency measure is Power Usage Effectiveness, or PUE. It is total facility energy divided by the energy used by IT equipment alone. A PUE of 1.0 would mean every watt goes to computing, with none spent on cooling or power conversion. Large operators report fleet averages near 1.1, with the best individual sites lower, while typical facilities run higher. Calculating PUE continuously, rather than monthly, requires metering both the incoming grid power and the power delivered to the IT load.
| Measurement Point | What It Captures | Typical Sensor |
|---|
| Utility service entrance | Total facility power | Revenue-grade meter |
| UPS output and rack PDUs | Power delivered to IT equipment | Intelligent PDU, branch circuit meter |
| Chillers, CRAH and CRAC units | Cooling energy | Current transformers, flow and temperature sensors |
| Raised floor and aisles | Temperature, humidity, water leaks | Wireless environmental sensors |
Cooling typically accounts for the largest share of non-IT energy. Monitoring lets operators match cooling to actual load rather than running conservatively, and vendor analyses suggest optimization can cut cooling energy by 20 to 35 percent, though results depend heavily on the starting point. A common inefficiency is overcooling when IT load dips. Continuous rack-level metering lets control systems ease off in real time instead of waiting for a human to notice.
There is also a part-load problem. PUE tends to worsen when a facility operates well below design capacity, because baseline cooling overhead stays fixed. New Illinois facilities that ramp up over several years therefore need monitoring most during the early phase, when the numbers look worst and the temptation to ignore them is highest.
The same data increasingly matters outside the building. Demand flexibility research has found that large data centers can shift or trim load during peak grid hours; one cited example is a reduction of about 25 percent at an Oracle facility during peak periods. That capability depends on accurate, real-time measurement, and it connects directly to the utility programs described in our piece on smart grid modernization and IoT opportunities across Illinois. A data center that can prove it reduced load on request is a more attractive neighbor to a strained grid.
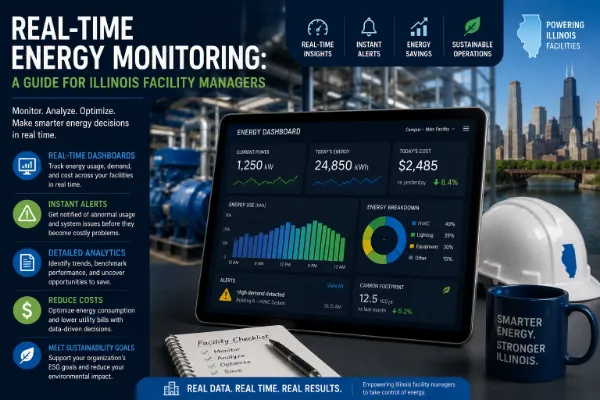
Facility-level storage fits the same picture. Operators pairing batteries with monitoring can manage peak demand, an approach explored in our piece on real-time energy monitoring for Illinois facility managers.
Consider an enterprise colocation facility in the Chicago suburbs running at roughly half its design capacity. Its operators measure PUE monthly from utility bills, which hides the fact that overnight overcooling pushes the real figure well above target. After adding branch circuit meters at the rack level and temperature sensors across the aisles, they see that several cooling units run at full output regardless of load. Letting the building management system modulate those units against live IT demand lowers cooling energy without touching any customer hardware. The same data becomes the basis for a customer-facing energy report, a feature tenants with sustainability commitments increasingly request.
Many existing data centers only meter at the UPS output, which makes accurate PUE difficult. Retrofitting sub-metering takes planning, because work near live power must not risk uptime.
High-density deployments can produce overwhelming sensor volumes. Without sensible alert thresholds and clear ownership, monitoring creates noise rather than improvement.
High-density AI workloads push toward liquid cooling, which changes what needs measuring. Flow, pressure, and leak detection become as important as air temperature, and community concern about water use, noted in our construction coverage, makes that data increasingly public.
Monitoring systems connect operational equipment to networks, which expands the attack surface. Segmenting these networks from IT systems should be part of the design from the start.
Expect continuous PUE reporting to become a standard expectation in colocation contracts, driven by customers with their own emissions targets. Expect monitoring to extend to water use alongside power as liquid cooling spreads. And expect data center operators to be asked, by utilities and regulators, to demonstrate not only how efficient they are but how flexible, which makes accurate, verifiable metering a competitive requirement rather than a back-office tool.
Browse more Energy & Sustainability coverage, including the Chicago Energy & Sustainability hub.
Power Usage Effectiveness is total facility energy divided by IT equipment energy. A lower number means less energy is spent on cooling and power conversion, so it is the standard way to track data center efficiency.
Chicago's data center capacity is growing quickly, with vacancy at 2.4 percent and rents rising, and utilities, regulators, and tenants all want verifiable data on how much power facilities use and how efficiently.
Vendor analyses suggest 20 to 35 percent through optimization, though the actual result depends on the facility's starting efficiency, load profile, and cooling design.
Baseline cooling and power overhead stays fixed even when IT load is low, so efficiency tends to degrade when a facility operates well below design capacity.
Research suggests large facilities can shift or trim load at peak times, with one cited example of about a 25 percent reduction, but doing so reliably requires accurate real-time metering.
Typical systems combine revenue-grade meters at the utility entrance, intelligent PDUs at the rack, current transformers on cooling equipment, and wireless sensors for temperature, humidity, and leaks.
Frequently asked questions
Power Usage Effectiveness is total facility energy divided by IT equipment energy. A lower number means less energy is spent on cooling and power conversion, so it is the standard way to track data center efficiency.
Chicago's data center capacity is growing quickly, with vacancy at 2.4 percent and rents rising, and utilities, regulators, and tenants all want verifiable data on how much power facilities use and how efficiently.
Vendor analyses suggest 20 to 35 percent through optimization, though the actual result depends on the facility's starting efficiency, load profile, and cooling design.
Baseline cooling and power overhead stays fixed even when IT load is low, so efficiency tends to degrade when a facility operates well below design capacity.
Research suggests large facilities can shift or trim load at peak times, with one cited example of about a 25 percent reduction, but doing so reliably requires accurate real-time metering.
Typical systems combine revenue-grade meters at the utility entrance, intelligent PDUs at the rack, current transformers on cooling equipment, and wireless sensors for temperature, humidity, and leaks.
Related articles


 Energy & Sustainability