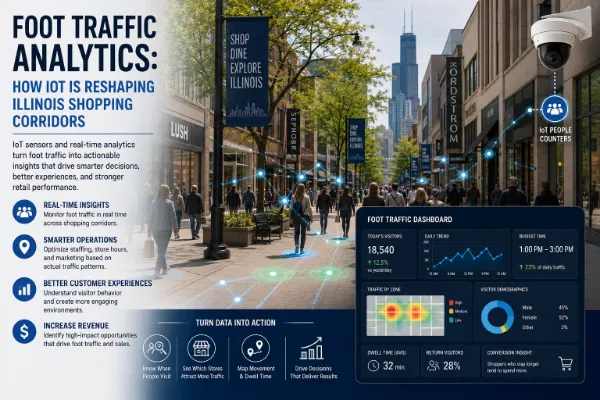
Chicago's major retail corridors are, in the words of local business reporting, moving out of survival mode and into thriving but the data behind that recovery tells a genuinely uneven story that foot traffic analytics has made visible in ways that simple vacancy statistics alone wouldn't capture. According to Placer.ai data, retailers along the Magnificent Mile and downtown corridors still feel a pinch on weekdays between 8 a.m. and 4 p.m., directly tied to office return-to-work numbers that continue lagging pre-pandemic levels. But weekends tell a different story entirely: Friday night visits are up 2% and Saturday evening visits up 0.7% compared to the same point in 2019, while JLL data shows foot traffic in the Fulton Market and Oak Street corridors increased 4% year over year from 2024 to 2025, with the Mag Mile itself up a smaller but still positive 0.5%.
A retail vacancy rate alone tells a landlord or investor whether storefronts are occupied, but it says nothing about whether those occupied stores are actually seeing the customer volume needed to sustain their leases long-term. Chicago's Magnificent Mile Association has specifically credited increased foot traffic with helping attract the wave of new retailers filling previously empty storefronts, covered in more detail in this site's coverage of Illinois smart shelf technology meaning foot traffic data functions as a genuinely leading indicator for retail recovery, one that landlords, brokers, and prospective tenants increasingly rely on directly when evaluating whether a specific corridor's improving vacancy numbers reflect a durable recovery or a more fragile, still-uncertain rebound.
The persistent gap between recovering weekend traffic and still-lagging weekday traffic creates a genuinely practical staffing and inventory challenge for Illinois retailers operating in downtown corridors specifically a store that staffs and stocks based on a flat, undifferentiated weekly average risks being meaningfully understaffed during weekend surges while carrying excess labor cost during still-recovering weekday periods. Foot traffic analytics that break down customer volume by specific day and hour, rather than reporting only aggregate weekly or monthly totals, let retailers align staffing and restocking schedules with Illinois's current, genuinely two-speed downtown retail pattern a pattern that's likely to persist for as long as return-to-office rates in Chicago's core continue lagging their pre-pandemic baseline.
Local business analysis points to a specific underlying shift worth understanding: shoppers are increasingly looking for destinations that offer more than shopping alone dining, experiences, and events a pattern that lines up directly with the stronger foot traffic growth in Fulton Market and Oak Street specifically, corridors that have leaned more heavily into experiential retail and dining than the Mag Mile's more traditional department-store-and-flagship format. For retailers and corridor associations using foot traffic data to guide leasing and programming decisions, this pattern suggests that corridors successfully pairing retail with genuine destination appeal are outperforming those relying on retail alone, a distinction that foot traffic analytics makes measurable rather than anecdotal.
Small, independent retailers within these corridors have specifically credited foot traffic recovery with supporting their own business viability Maria Belokurova, owner of Raw Edge inside The Shops at North Bridge on Michigan Avenue, has noted that increasing foot traffic helps not just anchor stores like the neighboring Nordstrom, but smaller boutique retailers like hers as well, with more customers returning each year. This illustrates a genuinely important dynamic foot traffic analytics helps quantify: a corridor's overall traffic recovery doesn't distribute evenly across every individual retailer, and smaller, independent stores benefiting from anchor-driven foot traffic have a genuine interest in understanding exactly how much of their own customer volume depends on nearby larger draws, information that granular, sensor-based foot traffic data can actually reveal in a way that a store's own point-of-sale data alone cannot.
Not every Illinois retail property is participating equally in this recovery, and foot traffic data helps explain why. Water Tower Place, historically one of Chicago's premier downtown shopping destinations, has continued struggling even as the broader Mag Mile corridor improves the property lost its Macy's anchor and is now selling off top floors for potential office conversion, having already been walked away from by its prior ownership group. This divergence between an improving corridor overall and a specific struggling property within it illustrates why foot traffic analytics needs to be applied at the individual property level, not just the broader corridor level aggregate Mag Mile recovery data alone wouldn't necessarily predict that a specific anchor property within that same corridor continues facing genuine structural decline.
For most individual Illinois retailers, a single well-placed entrance or zone counter paired with basic dwell-time tracking delivers the bulk of actionable insight at a fraction of the cost of a full computer-vision deployment, and it's worth noting that corridor-level foot traffic data the kind Placer.ai and JLL already compile for major corridors like the Mag Mile and Fulton Market is often available to individual tenants through their landlord or local business association at no additional cost. A retailer opening a new Illinois location should ask their prospective landlord or the relevant corridor association, like the Magnificent Mile Association, whether this kind of aggregate data is already being shared with tenants before investing in redundant, store-level tracking infrastructure to answer the same corridor-wide questions independently.
While the Mag Mile and Fulton Market data covered throughout this article specifically reflect downtown Chicago, the same underlying foot traffic analytics logic applies to shopping corridors in Illinois's other major cities Naperville, Aurora, and Rockford's own commercial districts face their own versions of the weekday-weekend and destination-versus-shopping-only dynamics documented here, even without the same volume of publicly reported Placer.ai and JLL data covering downtown Chicago specifically. Retailers and corridor associations in these smaller Illinois markets can apply the same core analytical framework segmenting traffic by day and hour, distinguishing destination-driven corridors from pure shopping corridors using more modest, locally deployed sensor technology rather than relying on the kind of large-scale third-party data platforms most readily available for Chicago's downtown core specifically.
For retailers evaluating new Illinois locations, and for corridor associations like the Magnificent Mile Association working to sustain the current recovery trajectory, foot traffic analytics increasingly functions as core decision-making infrastructure rather than a supplementary reporting tool. Retailers should weigh not just a corridor's aggregate recovery trend, but its specific weekday-versus-weekend pattern and its mix of destination-driving experiential retail versus traditional shopping-only format, given how directly these factors are now shown to affect which specific Illinois corridors and properties are actually recovering versus which remain genuinely at risk despite occupying the same broader geographic market.
Frequently asked questions
Weekend traffic has recovered close to or above 2019 levels Friday night visits up 2% and Saturday evening visits up 0.7% while weekday traffic between 8 a.m. and 4 p.m. continues lagging due to incomplete office return-to-work rates.
Fulton Market and Oak Street saw a 4% year-over-year foot traffic increase from 2024 to 2025 according to JLL data, outpacing the Mag Mile's more modest 0.5% increase over the same period.
The property lost its Macy's anchor and is selling off top floors for potential office conversion, illustrating that foot traffic and vacancy recovery doesn't distribute evenly across every property within an improving corridor.
Shoppers are increasingly seeking destinations offering dining and experiences alongside shopping, a pattern that favors corridors blending retail with genuine destination appeal over more traditional shopping-only formats.
It reveals how much of a smaller store's customer volume depends on nearby anchor stores or corridor-wide traffic patterns, information that a store's own point-of-sale data alone can't capture.
Aggregate corridor recovery data can mask genuine struggles at specific properties, as illustrated by Water Tower Place's continued decline despite the broader Mag Mile's improving vacancy and traffic trends.
Related articles

 Retail IoT